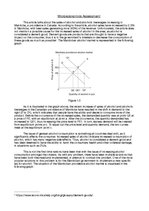
As it is illustrated in the graph above, the recent increase of sales of alcohol and alcoholic beverages in the Canadian providence of Manitoba have resulted in the shift in demand to the right (D to D1), which indicates that people have the ability and desire to consume more of the product. Before the occurrence of the increased sales, the demanded quantity was at point QE at a price of PE, with an equilibrium at point a. After the occurrence, the quantity demanded has increased to QE1, thus increasing the price level to PE1. In turn, excess demand will be created from equilibrium points a-c. To equal out the price level and quantity demand, the two curves meet at the equilibrium point c.
The issue of general alcohol consumption is something all countries deal with, as it
significantly affects the consumer. Increased sales of alcohol indicate increased consumption of alcohol, which has many negative side-effects. Thus, alcohol is considered a demerit good and
has been deemed to have the ability to harm the consumers health and other collateral damage, in situations such as DUIs.
…